Page 1 of 1
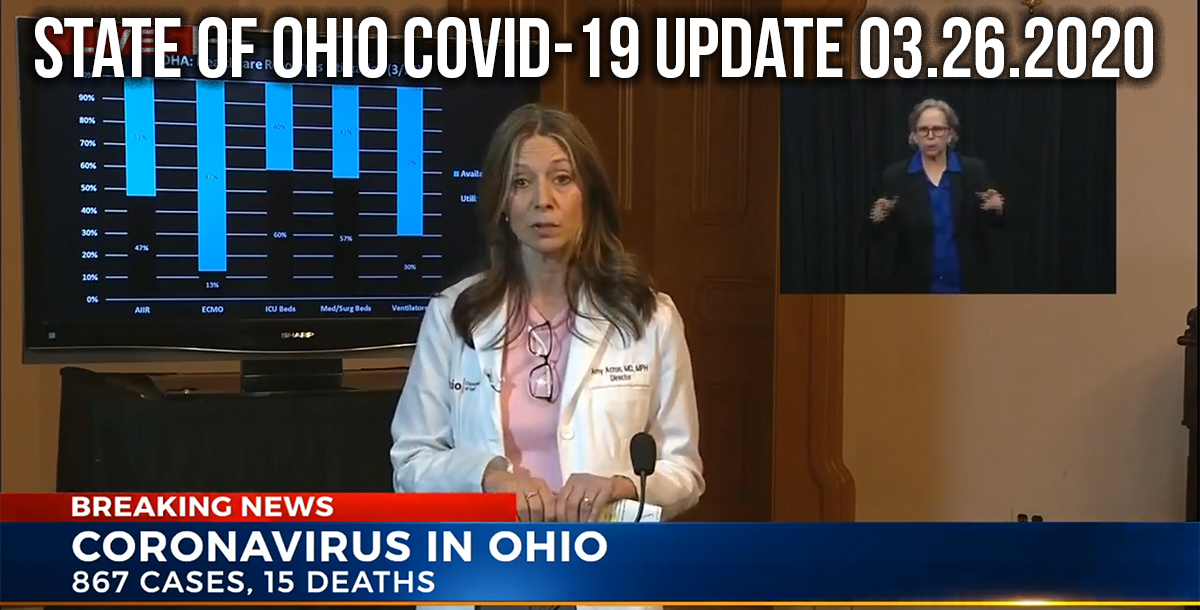
State of Ohio COVID-19 Update 03.26.2020
Posted: Thu Mar 26, 2020 1:37 pm
by Jim O'Bryan
Charts from today follow later in the thread.
Today’s Update From State of the Ohio
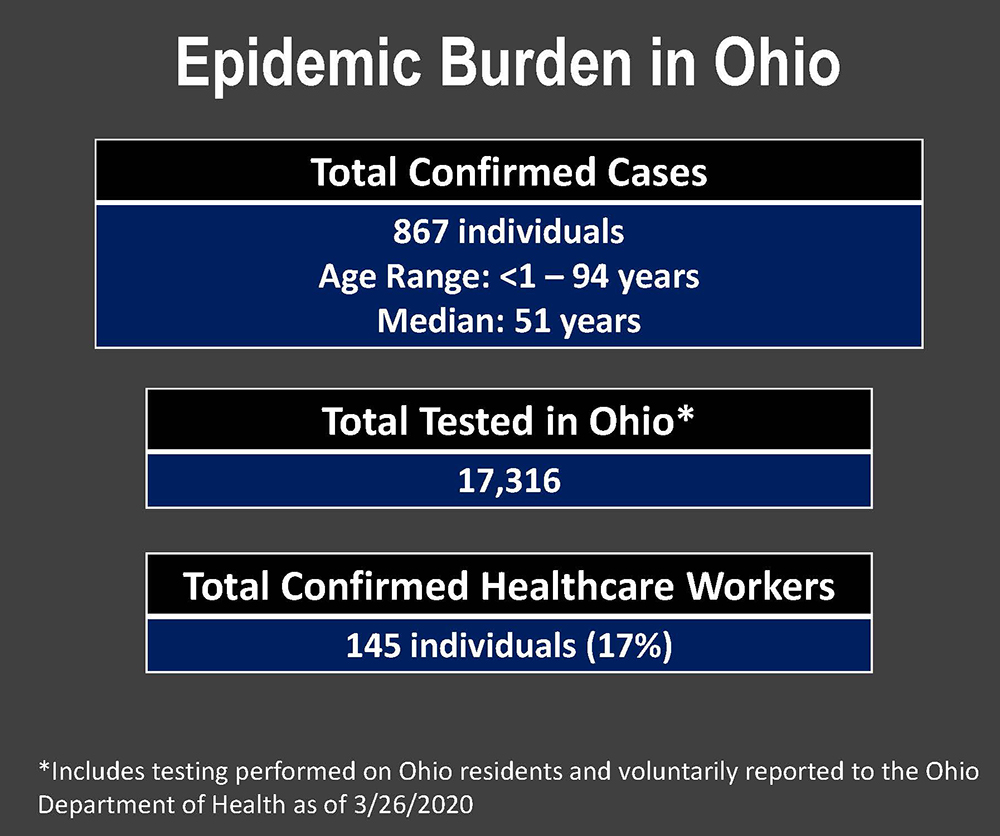
867 Tested Positive, testing is still slow
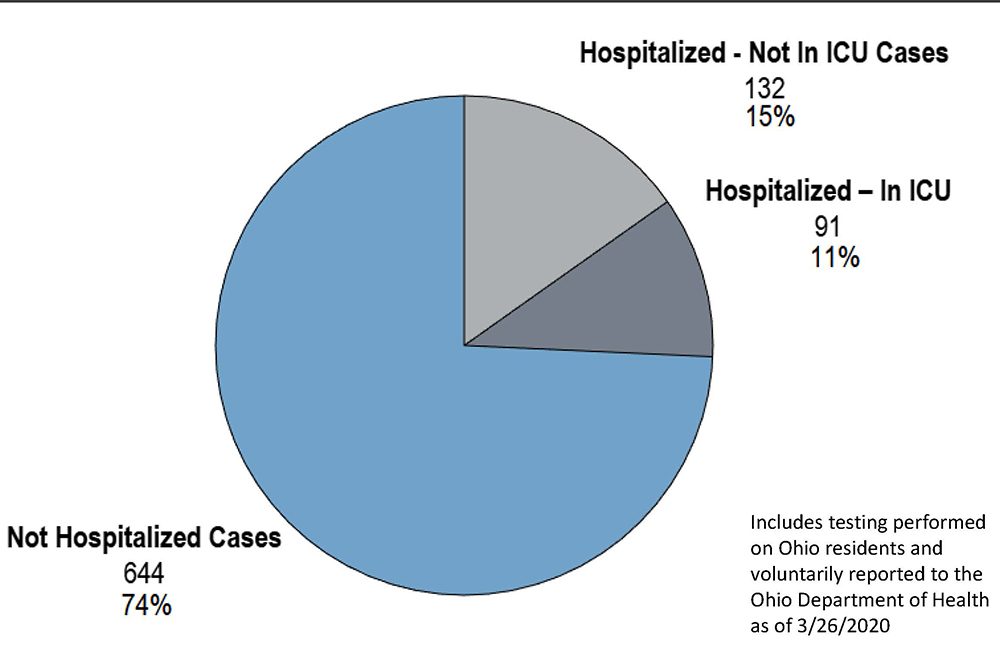
223 In Hospital
15 Deaths
60 Counties
11% Infected in ICU
17,316 Tests given
145 Health Care Workers Infected
17% of all cases
The preliminary modeling curve shows Ohio is beating the odds, and staying home is working. Even though it is working, testing is still lagging behind, and we could see spikes of over 6,000 or 8,000 cases a day.
There is a Bill going through the Ohio House that would give courts leeway on court timing.
Distancing is buying us time.
Keep it going!
We get through this together, as a community, standing 9’ apart for now.
.
Re: State of Ohio COVID-19 Update 03.26.2020
Posted: Thu Mar 26, 2020 2:16 pm
by Mark Kindt
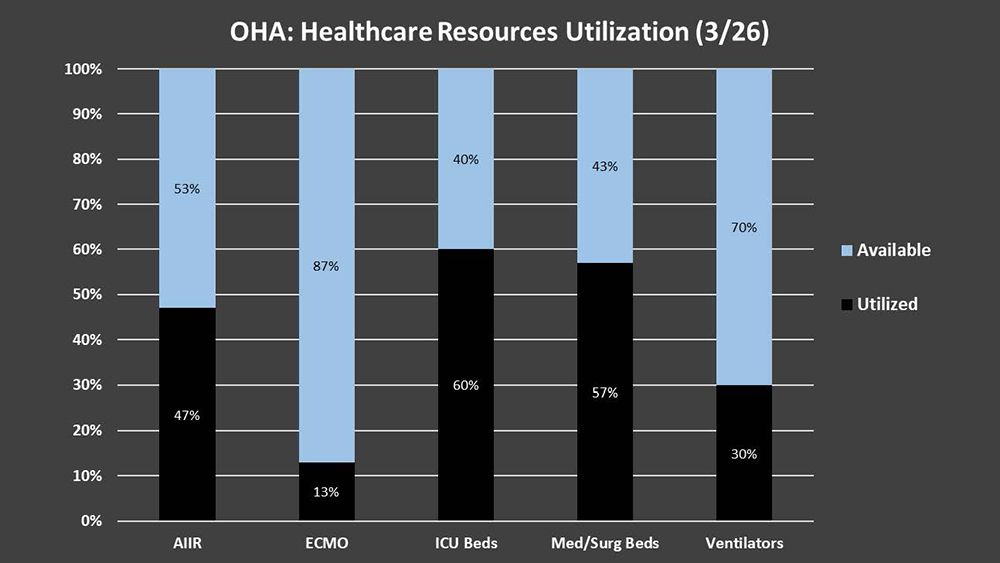
Here is the graph that is behind Dr. Acton:
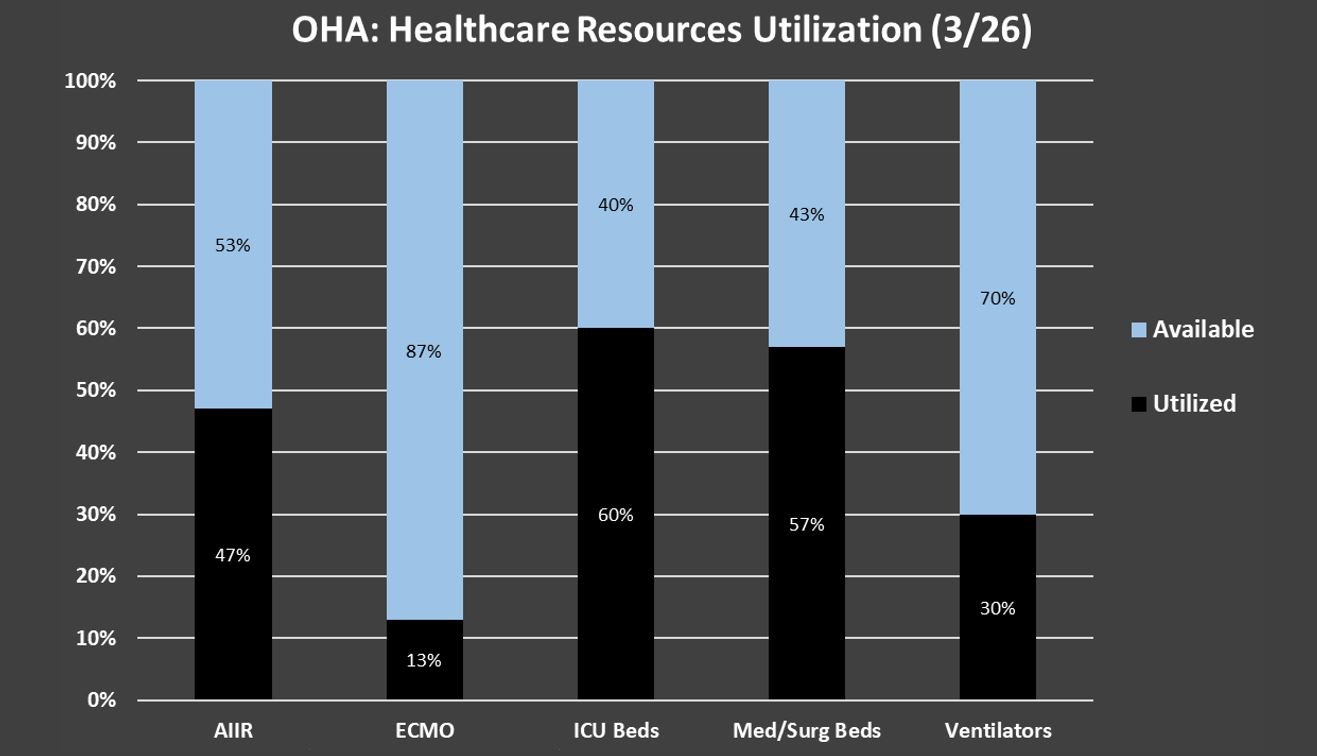
- OHA utilization graph - March 26 - 2020.jpg (54.72 KiB) Viewed 5320 times
It shows capacity and utilization by percentage as of today.
Re: State of Ohio COVID-19 Update 03.26.2020
Posted: Thu Mar 26, 2020 2:43 pm
by Jim O'Bryan
The Projections of Varios Modeling based on daily numbers.
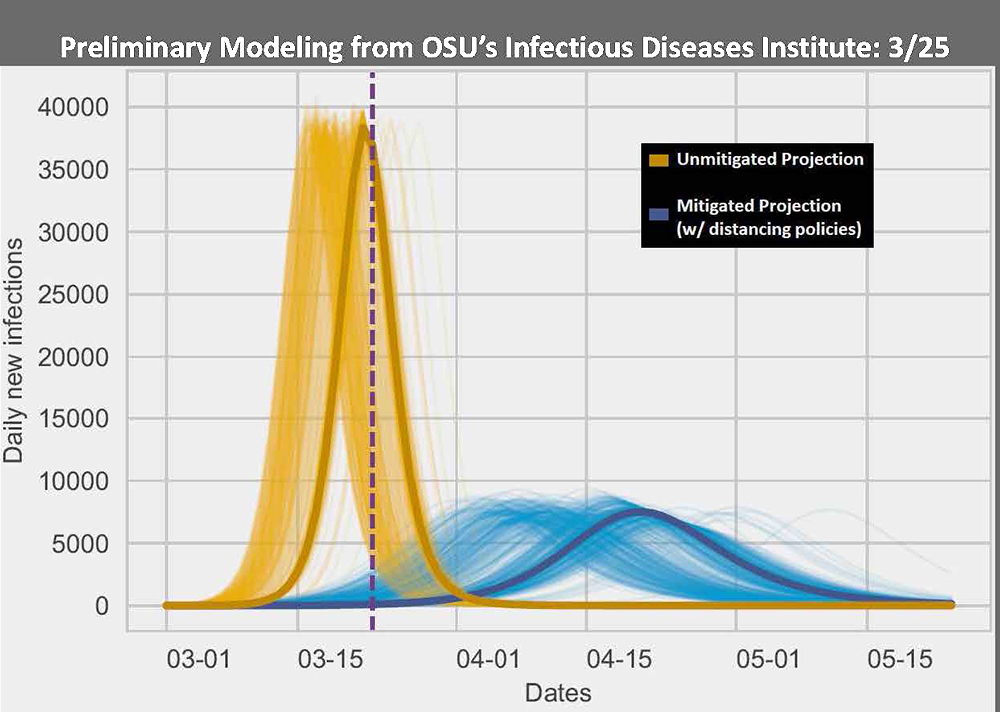
If you look at actual numbers you will see we are closer to the blue curve than the original projected orange curve.
This means social distancing and staying home is working!
Hospital Equipment and Projected Need
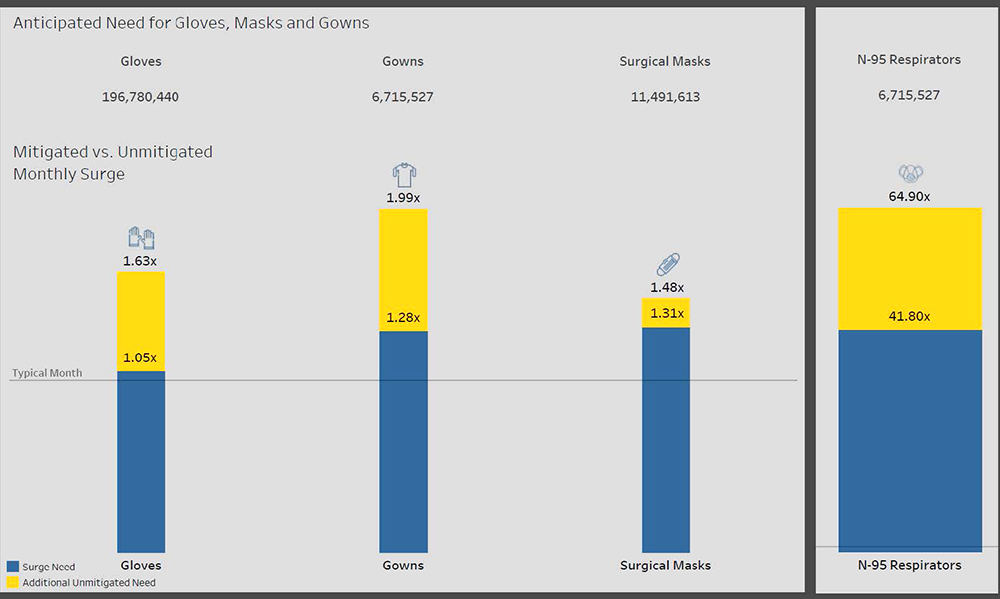
Posted earlier by Mr Kindt, shows that as of today, it is still manageable, and with the curve, gets tougher but stays manageable.
.